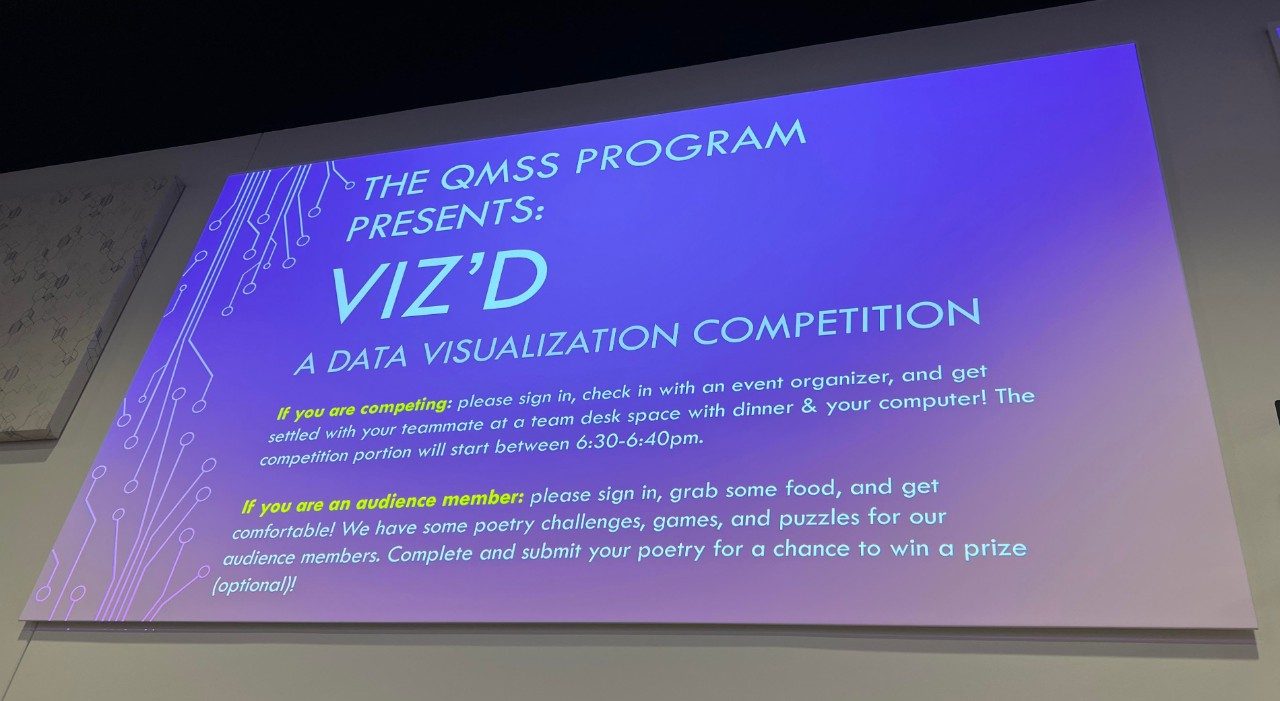
On Wednesday, October 26th, the QMSS department hosted its annual VIZ’D Data Visualization Competition. Competitors and a live audience were welcomed into the Central Campus Classroom Building with Jerusalem Garden and a table stocked with prizes to eye before the games began. In this exciting event, seven teams of two to three members took on the unique challenge of transforming data on breweries into poetry and engaging visualizations, proving that even data analysts can tap into their humanities and creativity skills. The competition, which was open to students and friends of QMSS, was a lively and dynamic celebration of the diverse skill sets and problem solving abilities of QMSS students.
Organizing VIZ’D was a community effort spearheaded by Peer Mentors, faculty, and staff, especially Dr. Elizabeth Whittaker and Caitlin Posilico (Program Manager for QMSS). The VIZ'D competition was inspired by the popular TV show "Chopped." This year, the engaging datasets provided to competitors were centered around breweries. Competitors were tasked with testing their chart-making skills and teamwork using fun datasets in Tableau, Excel and even R. Each team received a basket of ingredients (data) and could consult a "sous chef," one of the QMSS Peer Mentors, for guidance and support as they tackled their challenges.
The datasets provided a diverse range of information about craft breweries. Dataset 1 included the names of local Michigan breweries, their types, and locations. Dataset 2 presented an overview of the distribution of operating craft breweries in the United States from 2012 to 2022. It was revealed that in 2022, there were a total of 9,552 craft breweries in the United States, with 3,418 of them listed as brewpubs. Dataset 3 focused on the number of craft breweries by state, while Dataset 4 delved into beer characteristics, such as Alcohol By Volume (ABV), organized by beer ID and brewer ID.
One team, led by Will and Kripa, opted to work in R and created a bar chart to visualize the number of breweries by type (brewpub, micro, regional, taproom). Despite describing their beginning mindset as “nervous” and “stressed”, they had fun and were doing an exceptional job, even though R was a slower tool compared to some competitors using Tableau. The diversity of approaches and the passion for their chosen tools were evident throughout the competition.
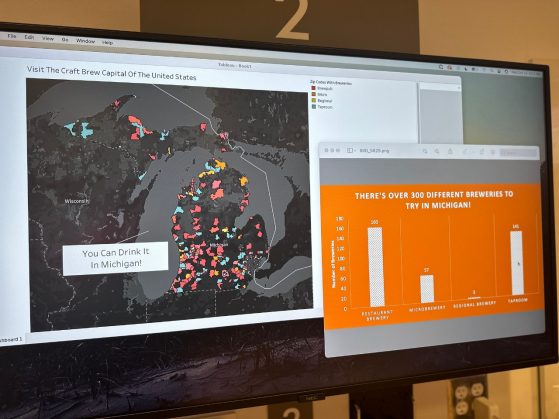
The competition featured an "Appetizer Round" where participants were given a background, intended audience, and challenge. They were tasked with visualizing the Michigan craft brewery scene, with a focus on the location and types of craft breweries in the state. Results included maps, proportion charts, frequency bar charts, and color-coded visualizations by zip code, all designed to convey the variety and concentration of breweries across Michigan. Jan Van den Bulck, QMSS Director and presiding judge of the competition, pointed out, "Visualization comes from creativity. It doesn't always look the same based on the numbers." This emphasized the idea that the choice of visualization should align with the specific story the data intends to tell.
The "Main Course Round" further challenged the participants to explore the craft brewery industry. They had to create three out of four possible visualizations, including average Alcohol By Volume (ABV) by country, average review ratings by country, the number of craft breweries across the US, and the industry's growth over time. Each visualization aimed to uncover valuable insights and trends within the craft brewery domain.
As the competition concluded, winners and runners-up were recognized for their outstanding visualizations, and the VIZ'D competition showcased the power of creativity in the world of data analysis. It demonstrated that data analysts, no matter how analytical their field, can infuse artistry and ingenuity into their work, making it not just informative but visually captivating as well.
VIZ'D is a testament to the power of collaboration, innovation, and the boundless potential of QMSS students when coupled with creativity. In an ever-evolving field, events like VIZ'D are a reminder that data analysts can embrace the best of both worlds - the analytical and the artistic - to tell compelling stories with data. So, next time you find yourself working with a data analyst, remember that their skills extend beyond numbers and charts; they might just surprise you with a touch of poetry and a flair for the creative.