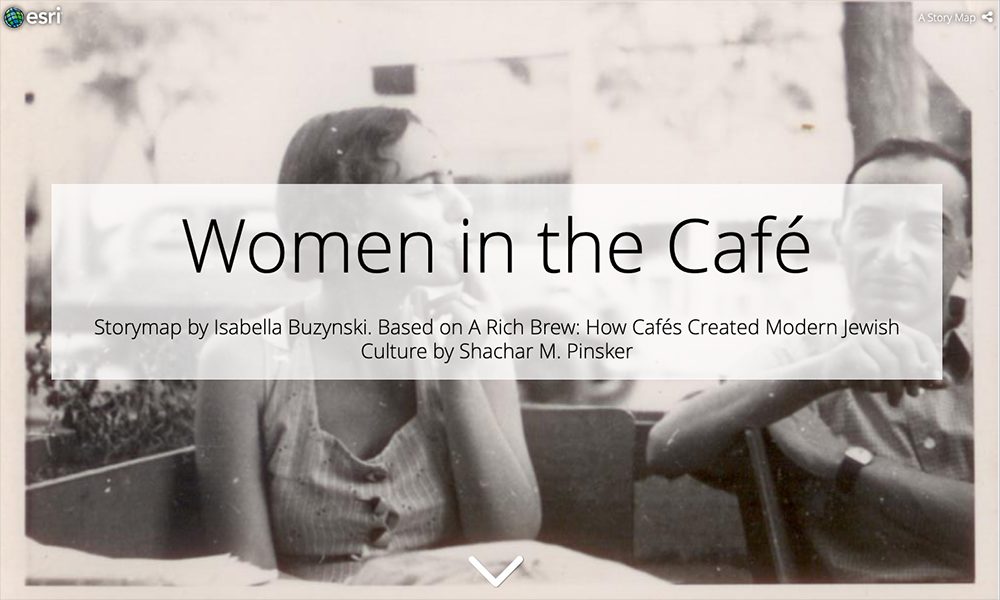
Women in the Café: StoryMap by Isabella Buzynski for the Mapping Modern Jewish Cultures
Do you have a story to tell? Are location or geographic relationships a key component of your message? Looking for innovative ways to communicate research? Interested in exploring multimedia assignments? ArcGIS StoryMaps may be the platform for you. With no coding required, StoryMaps combine images, text, audio, video, and interactive maps in a beautiful, captivating web experience. StoryMaps can be shared with groups of users (a class), with an organization (University of Michigan), or with the world, which makes them convenient for a wide variety of uses. Over 2000 StoryMaps have been created at the University of Michigan in the past 5 years.
StoryMaps are already being used in a myriad of ways within LSA. Interns at the Matthaei Botanical Gardens built StoryMaps to guide visitors on a virtual tour through the MBGNA gardens. The Summer in South Asia Fellowship students blogged about their experience abroad using StoryMaps.
LSA undergraduate student Isabella Buzynski created StoryMaps to accompany Judaic Studies Prof. Shachar Pinsker’s book “A Rich Brew: How Cafes Created Modern Jewish Culture.” These are embedded in the book’s companion website, Mapping Modern Jewish Cultures.
In lieu of traditional papers, students are using StoryMaps to explore rap and radicalism (DAAS 103; Prof. Kelly Askew), race and sexuality in Israel and Palestine (JUDAIC 418; Prof. Bryan Roby), cafe culture in Eastern Europe and Israel (NEAREST 295; Prof. Shachar Pinsker), and alternative energy futures for the University of Michigan campus (EARTH 380; Prof. Adam Simon). A common thread amongst courses using StoryMaps is the need to visualize information in a spatial context; however, StoryMaps can also be created without maps, or used as a presentation or instructional medium. StoryMaps, as part of the ArcGIS Online platform, is integrated with Canvas, which facilitates resource sharing and collaboration among class members at the Canvas Assignment level.
Instructors can find curriculum guides, complete with rubrics and suggested prompts, at the University of Minnesota StoryMaps Curriculum Portal.
This past summer, Esri updated the StoryMap experience, making it even easier to build an engaging narrative in your favorite web browser. Perhaps the most exciting enhancement is the ability to create ‘Express Maps’ on-the-fly, which allows you to quickly draw points, lines, and areas to create professional-looking cartographic maps. StoryMap users can also leverage the ArcGIS Living Atlas of the World, which includes thousands of authoritative geographic datasets such as census demographics, real-time weather, and administrative boundaries. To see what you can create, check out the new StoryMap gallery to explore the endless possibilities.
Looking for support or guidance in using StoryMaps? Contact the LSA Technology Services help desk. Or, come to one of our StoryMap workshops, which can be found on the Teaching and Technology Collaborative website.
If you’re new to StoryMaps, we recommend starting with a brief overview. You can also follow this step-by-step guide to creating your first StoryMap. All faculty, staff, and students can access the entire Esri platform as part of our site license. Simply sign in with your umich credentials using the following steps:
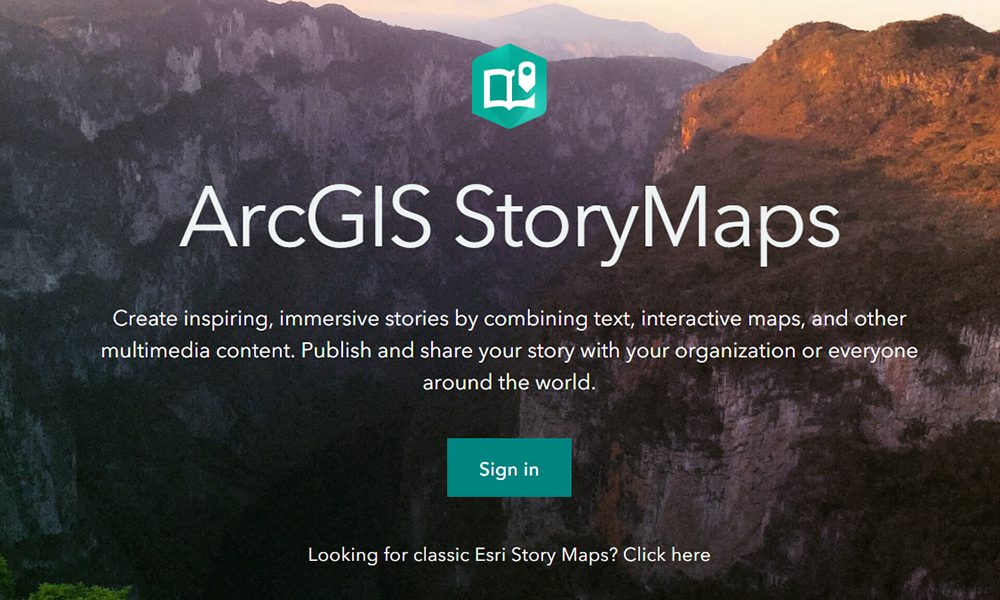
Go to https://storymaps.arcgis.com/ and click ‘Sign in’
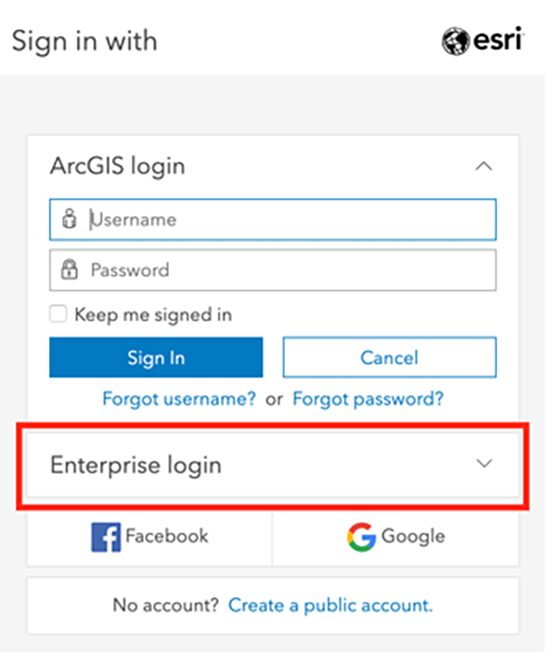
Click 'Enterprise login'
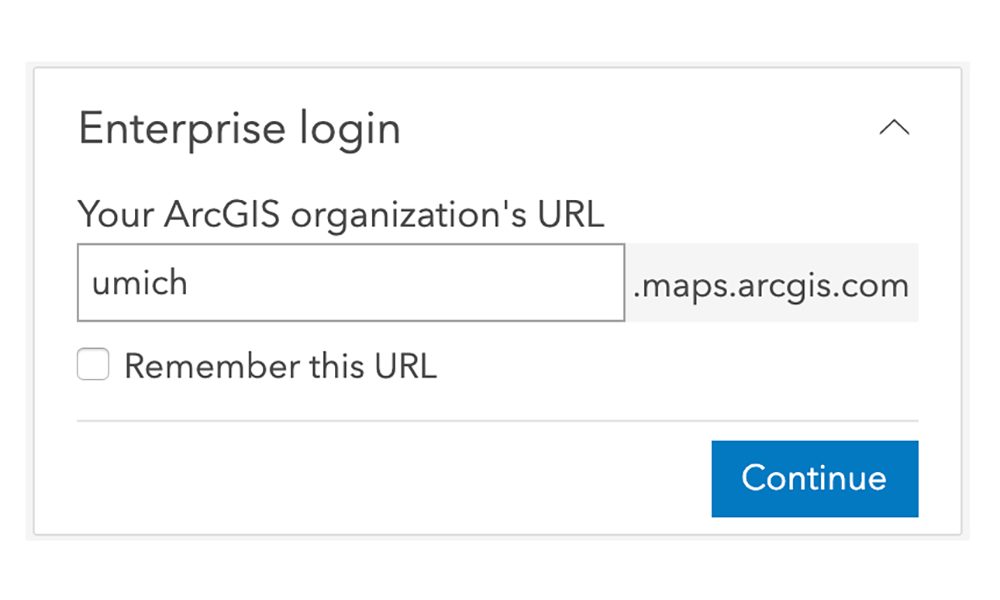
Enter ‘umich’ as the organization url
Sign in with weblogin